- 您现在的位置:买卖IC网 > Sheet目录124 > C4D20120A (Cree Inc)DIODE SIC 1200V 20A TO220-2

3
C4D20120A Rev. B
0
20
40
60
80
100
120
140
0
200
400
600
800
1000
1200
0
20
40
60
80
100
120
140
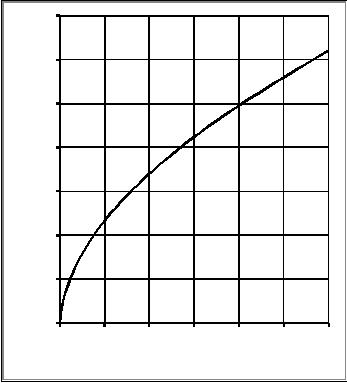
25
50
75
100
125
150
175
Figure 3. Current Derating
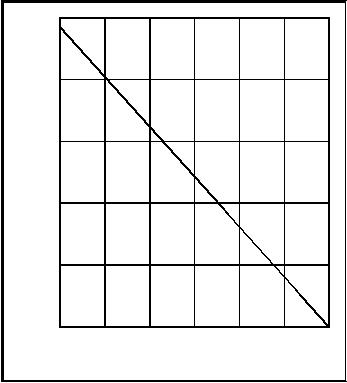
Figure 4. Power Derating
0
50
100
150
200
250
25
50
75
100
125
150
175
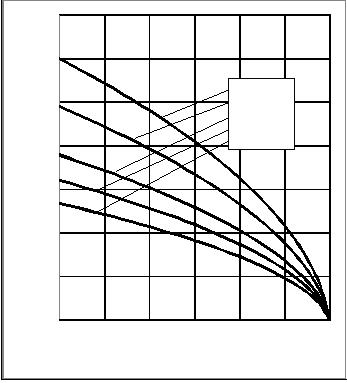
Figure 5. Recovery Charge vs. Reverse Voltage
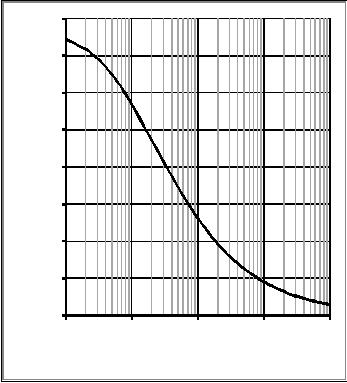
Figure 6. Capacitance vs. Reverse Voltage
Typical Performance
30% Duty
10% Duty
50% Duty
70% Duty
DC
0
200
400
600
800
1000
1200
1400
1600
0.1
1
10
100
1000
I
F(peak)
(A)
TC
?C
P
Tot
(W)
TC
?C
C (pF)
VR
(V)
Qrr (nC)
VR
(V)
发布紧急采购,3分钟左右您将得到回复。
相关PDF资料
CD1005-S0180
DIODE 90V 0.1A 2-PIN SOD-323F
CDBA1150-HF
DIODE SCHOTTKY 150V 1A DO-214AC
CDBA1200-HF
DIODE SCHOTTKY 200V 1A DO-214AC
CDBA120L-G
DIODE SCHOTTKY 20V 1A DO-214AC
CDBA120LL-G
DIODE SCHOTTKY 20V 1A DO-214AC
CDBA140-HF
DIODE SCHOTTKY 40V 1A DO-214AC
CDBA140L-G
DIODE SCHOTTKY 40V 1A DO-214AC
CDBA140LL-G
DIODE SCHOTTKY 40V 1A DO-214AC
相关代理商/技术参数
C4D20120A
制造商:Cree 功能描述:SILICON CARBIDE (SIC) SCHOTTKY DIODE 27
C4D20120D
功能描述:肖特基二极管与整流器 SIC SCHOTTKY DIODE 1200V, 2x10A
RoHS:否 制造商:Skyworks Solutions, Inc. 产品:Schottky Diodes 峰值反向电压:2 V 正向连续电流:50 mA 最大浪涌电流: 配置:Crossover Quad 恢复时间: 正向电压下降:370 mV 最大反向漏泄电流: 最大功率耗散:75 mW 工作温度范围:- 65 C to + 150 C 安装风格:SMD/SMT 封装 / 箱体:SOT-143 封装:Reel
C4D20120D
制造商:Cree 功能描述:SIC SCHOTTKY DIODE 32A 1.2kV TO-247
C4D2402S
制造商:Electro Switch Corp 功能描述:SWITCH ROTARY 24P-2POS ENCLOSED
C4D2704N
功能描述:旋钮开关 27POLE/4POS ROTARY
RoHS:否 制造商:C&K Components 位置数量:5 卡片组数量: 每卡片组极数:2 电流额定值:250 mA 电压额定值:125 V 指数角: 触点类型: 触点形式:DPST 端接类型:Solder 安装类型:Panel 触点电镀:Silver
C4D28DS29A1M396
制造商:Thomas & Betts 功能描述:
C4D3005N-0809
功能描述:旋钮开关 30 POLE ROTARY SWTCH
RoHS:否 制造商:C&K Components 位置数量:5 卡片组数量: 每卡片组极数:2 电流额定值:250 mA 电压额定值:125 V 指数角: 触点类型: 触点形式:DPST 端接类型:Solder 安装类型:Panel 触点电镀:Silver
C4D30120D
功能描述:肖特基二极管与整流器 SIC SCHOTTKY DIODE 1200V, 2x15A
RoHS:否 制造商:Skyworks Solutions, Inc. 产品:Schottky Diodes 峰值反向电压:2 V 正向连续电流:50 mA 最大浪涌电流: 配置:Crossover Quad 恢复时间: 正向电压下降:370 mV 最大反向漏泄电流: 最大功率耗散:75 mW 工作温度范围:- 65 C to + 150 C 安装风格:SMD/SMT 封装 / 箱体:SOT-143 封装:Reel
